Web Help
Plotting annotations
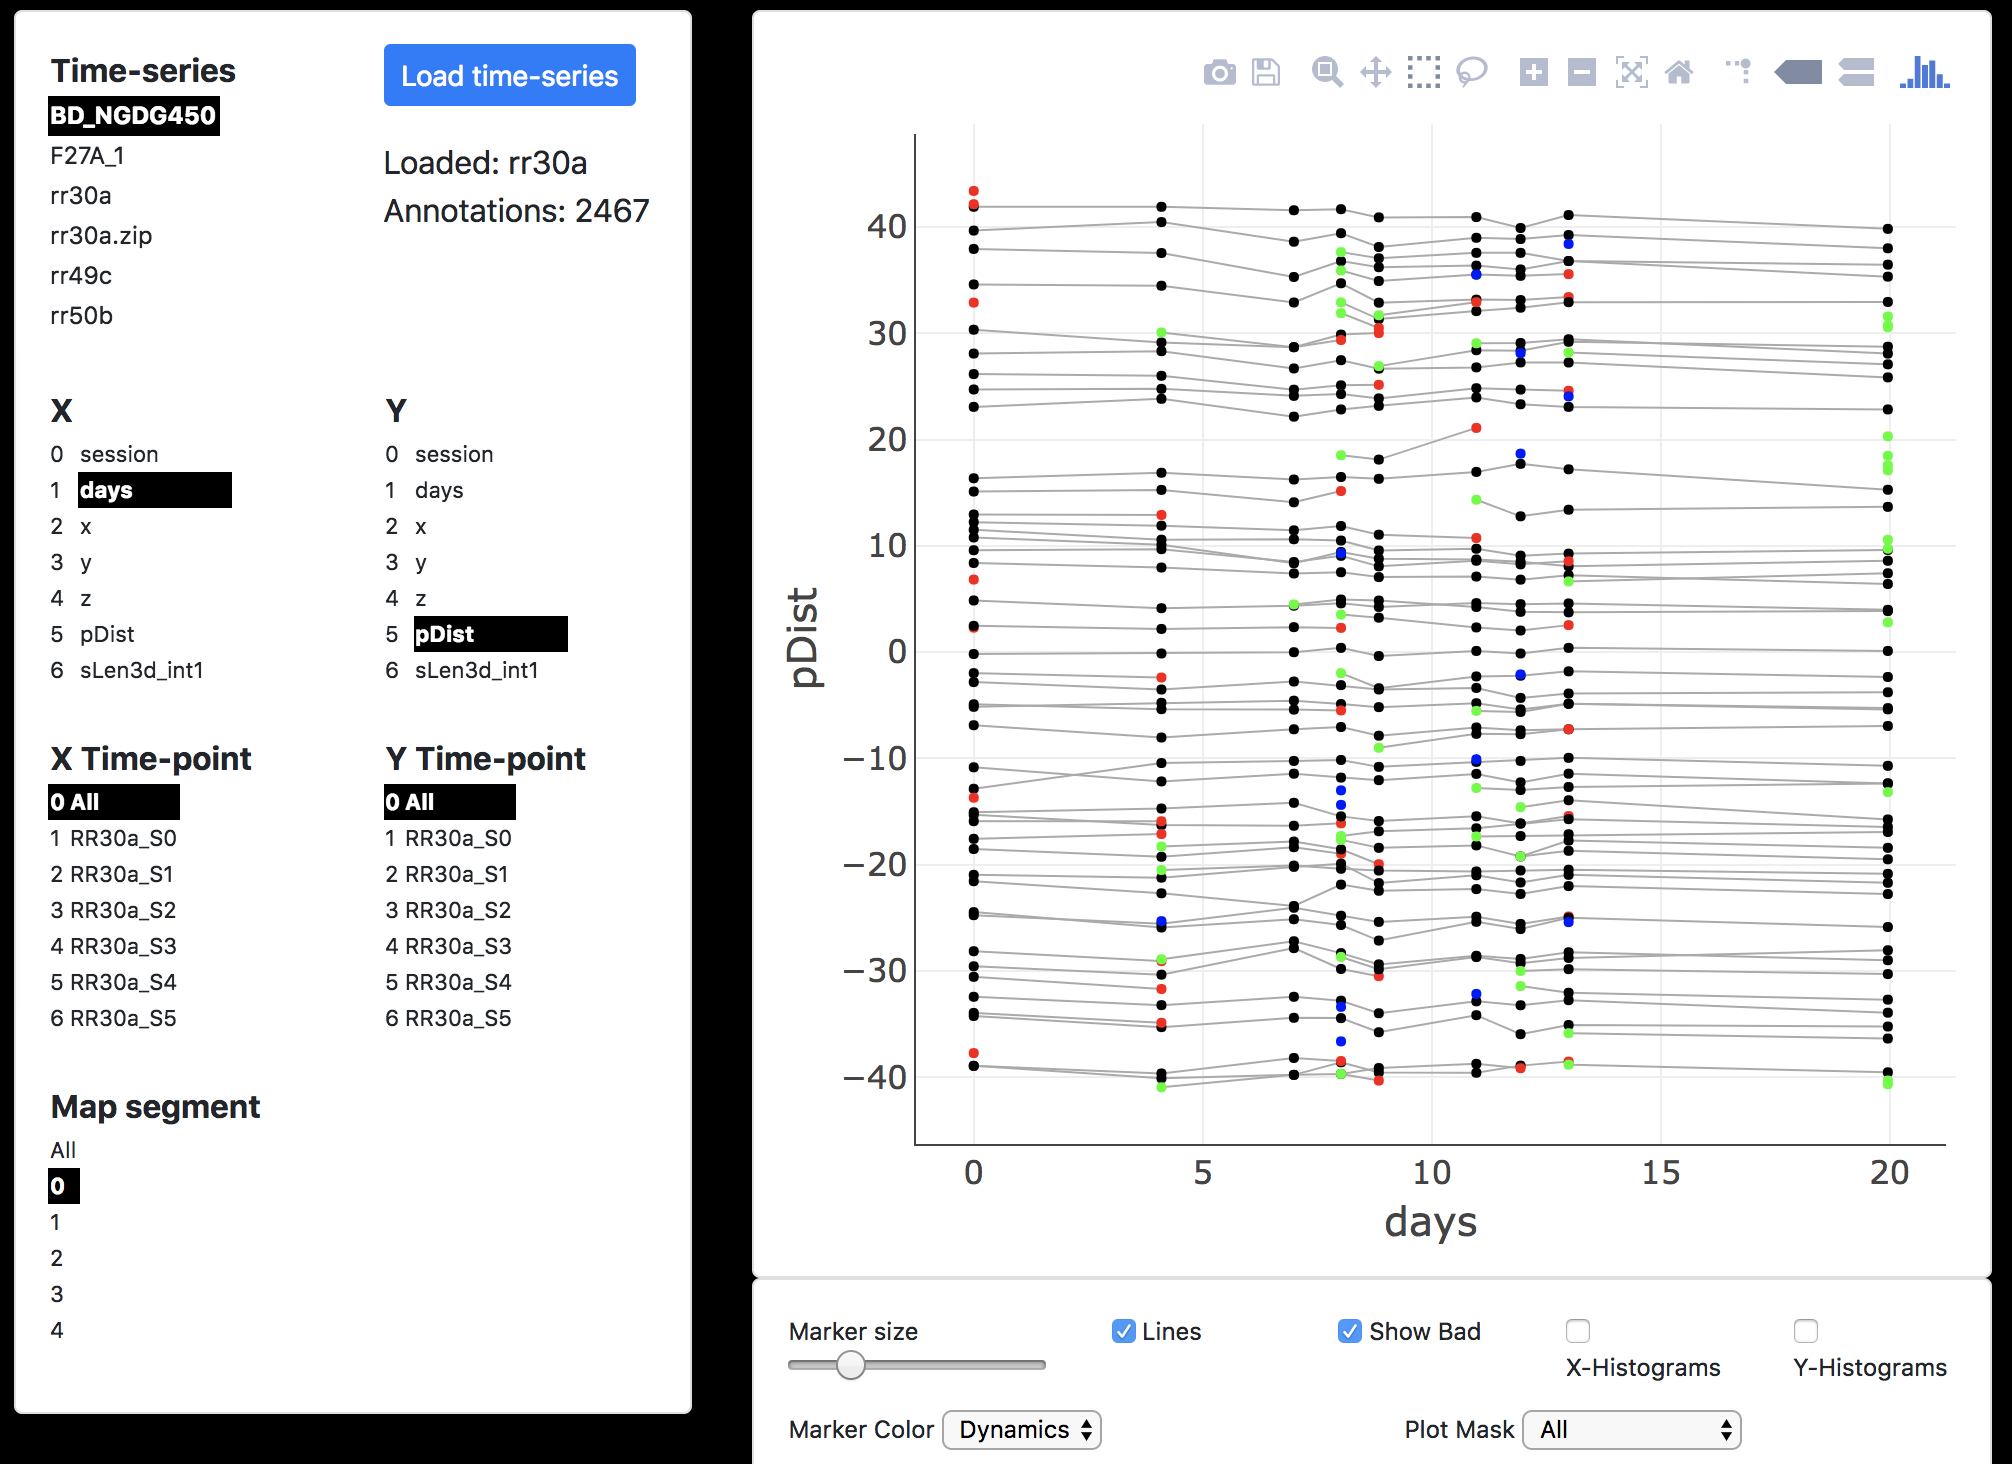
- Time-series and Load time-series. Select and then load a timeseries. Once a timeseries is loaded, all other plot interface elements will update the plot in real time.
- X and Y. Select X and Y values to plot.
- X time-point and Y time-point. Select X and Y timepoints to limit the plot to those timepoints. You must either select 'All' for both X and Y or select an individual timepoint for X and Y.
- Map segment. Select a segment to plot or select 'All' segment.
Clicking on an annotation in the plot will highlight other corresponding annotations and propagate this selection to the images (see below).
Browsing images
- Scroll Images. Mouse wheel.
- Pan. Click and drag.
- Zoom. Control + mouse wheel.
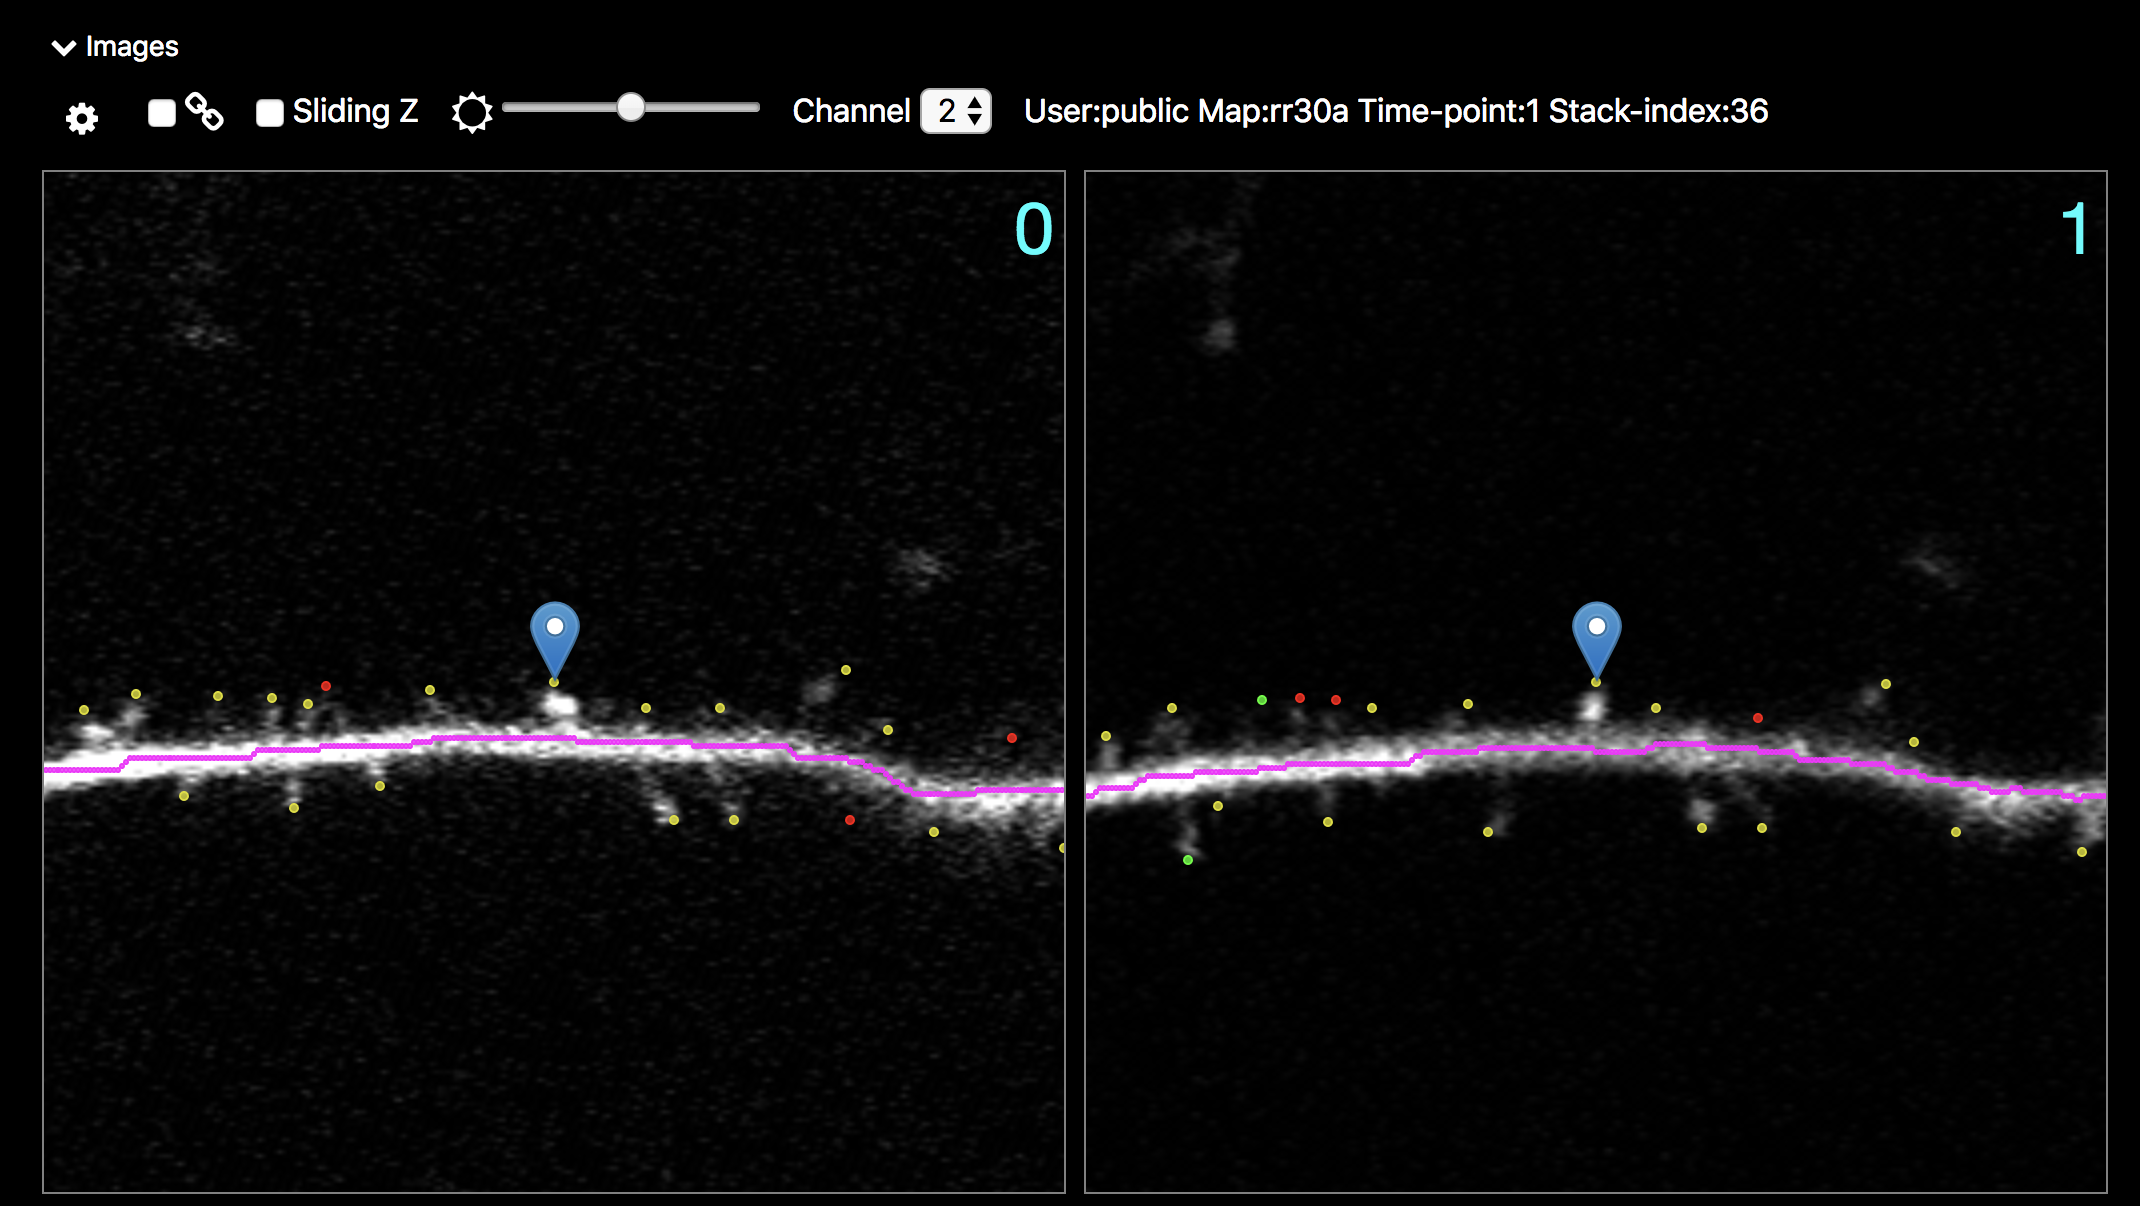
- Browsing corresponding annotation. Selecting an annotation with single-click will zoom into that annotation and snap all other images to the same annotation. As you hover the mouse, it is ready for selection when cursor turns from a hand (for dragging) to a finger-pointing (to select).


- Cog Icon. To control image options including hiding and showing the tracing and timepoint numbers and additional image controls for scrolling slices and panning.
- Link checkbox. links the images such that paging slices, panning, and zooming will affect all images. Really useful for browsing.
- Sliding Z. Make each image a small maximal z-projection to give a more volumetric view.
- Brightnesz slider. Make the images brighter and darker.
- Channel popup. Select the color channel to display. If no images appear, that channel is not available for the loaded map.
Downloading time-series
Time-series can be downloaded for further analysis and browsing in Map Manager Igor, Python, or Matlab.
Two types of downloads are available. Just the annotations, ~1 MB per time-series, is sufficient for most further analysis, or the annotations and the images (big files).