Home
PyMapManager is a suite of Python tools to visualize, annotate, and analyze time-series image volumes. PyMapManager opens annotations created with the Igor Pro version of Map Manager, allowing additional visualization and analysis to easily be performed.
There are three components to PyMapManager:
- A Python package
- A web server
- A desktop application.
1) PyMapManager Python package
Install with
pip install PyMapManager
To get started writing Python code to extend Map Manager analysis, see the iPython notebooks in the /examples folder. For more detailed install instructions, see Install PyMapManager. See the API Documentation for a full description of all the classes and functions.
2) PyMapManager server
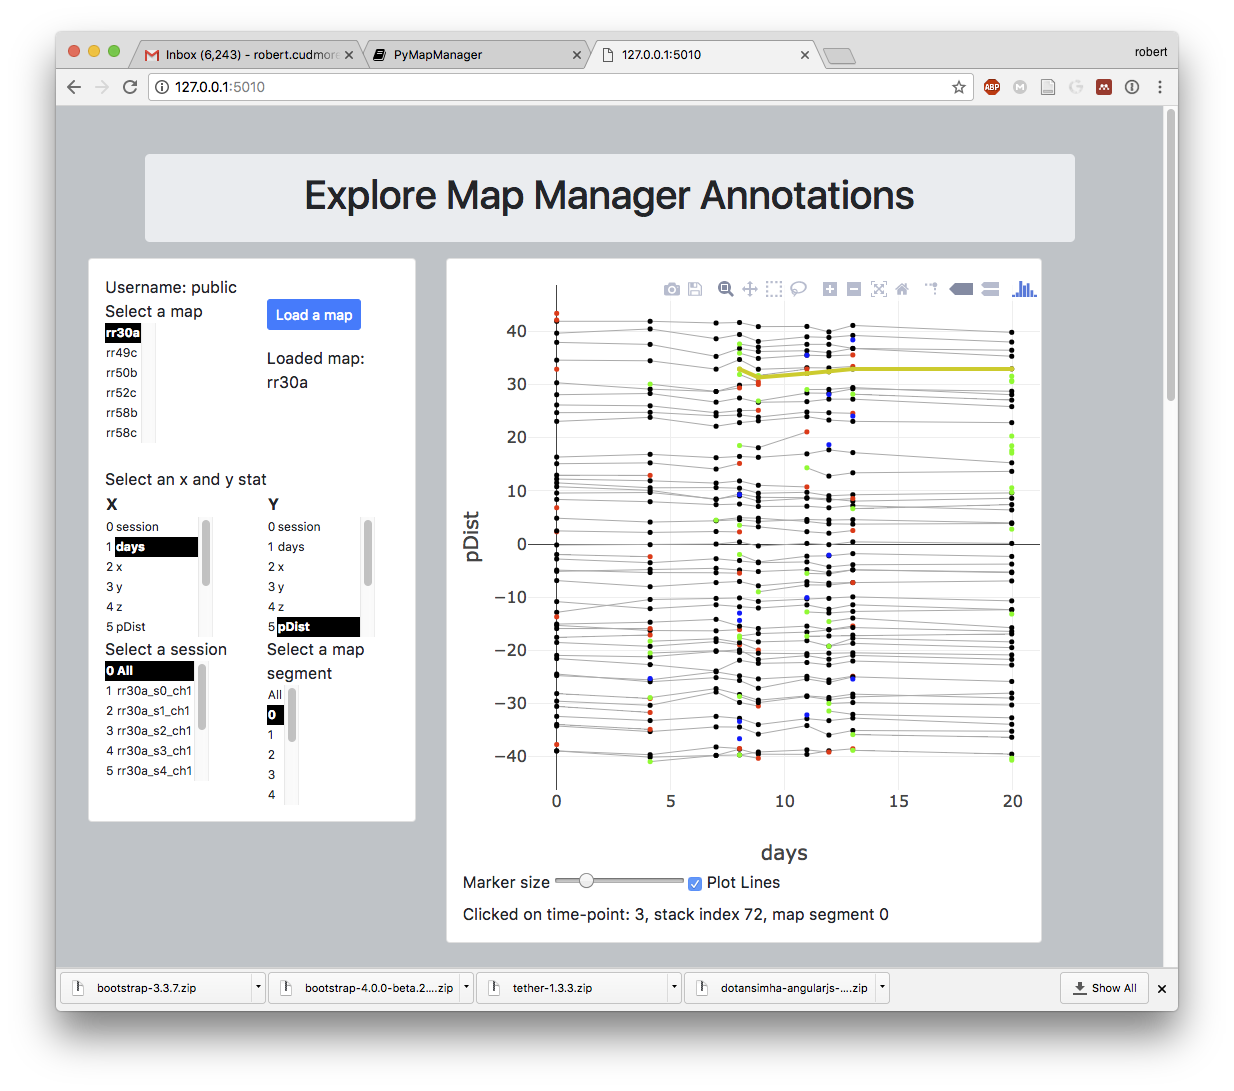
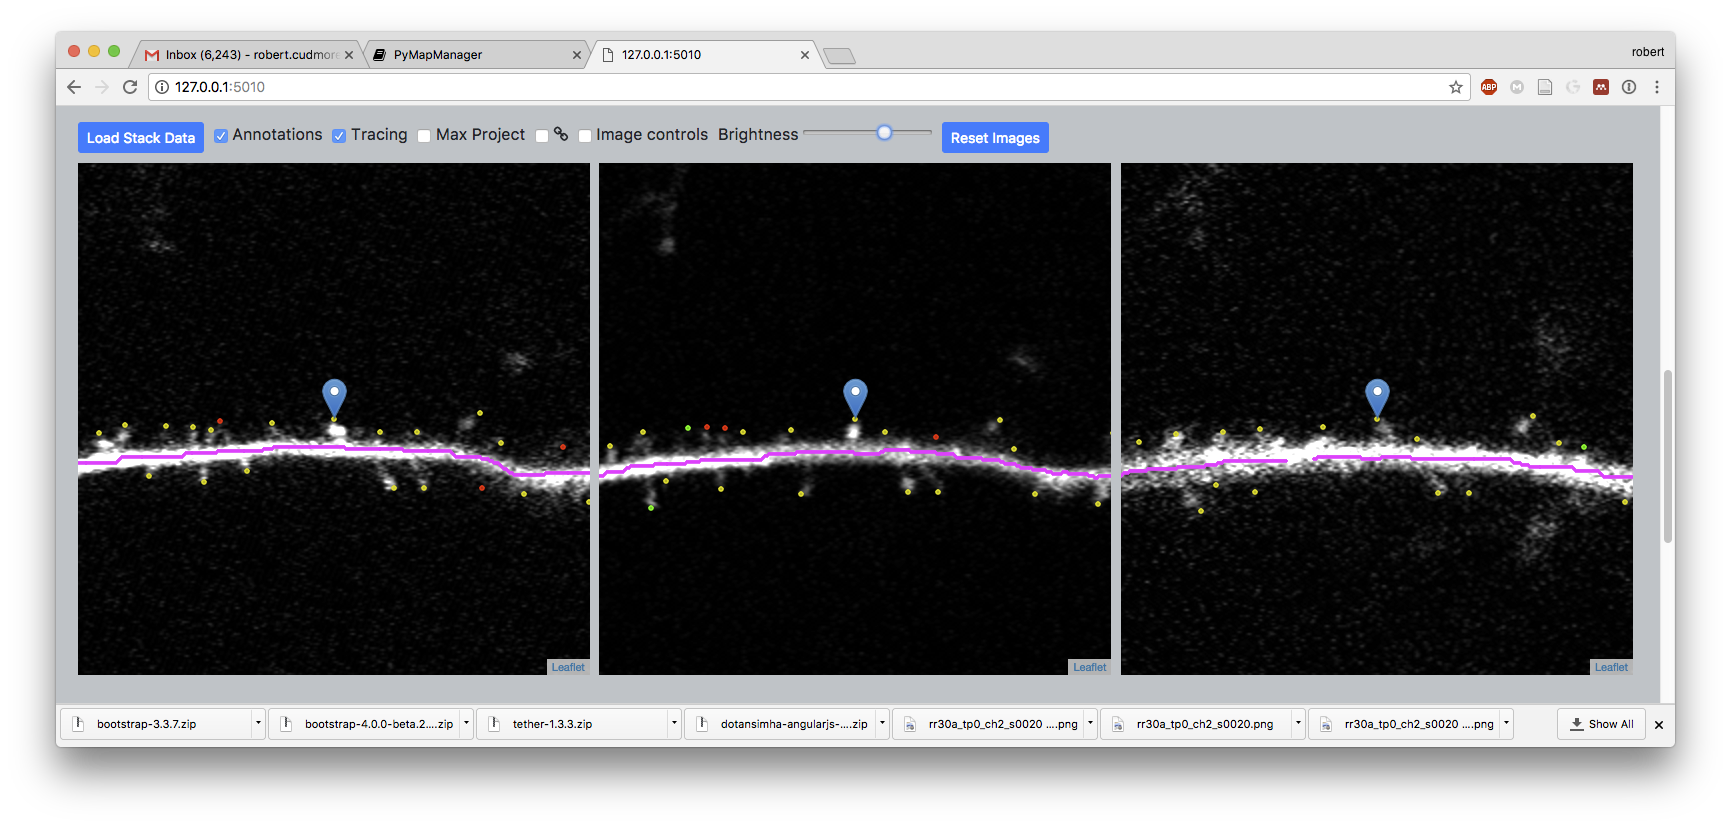
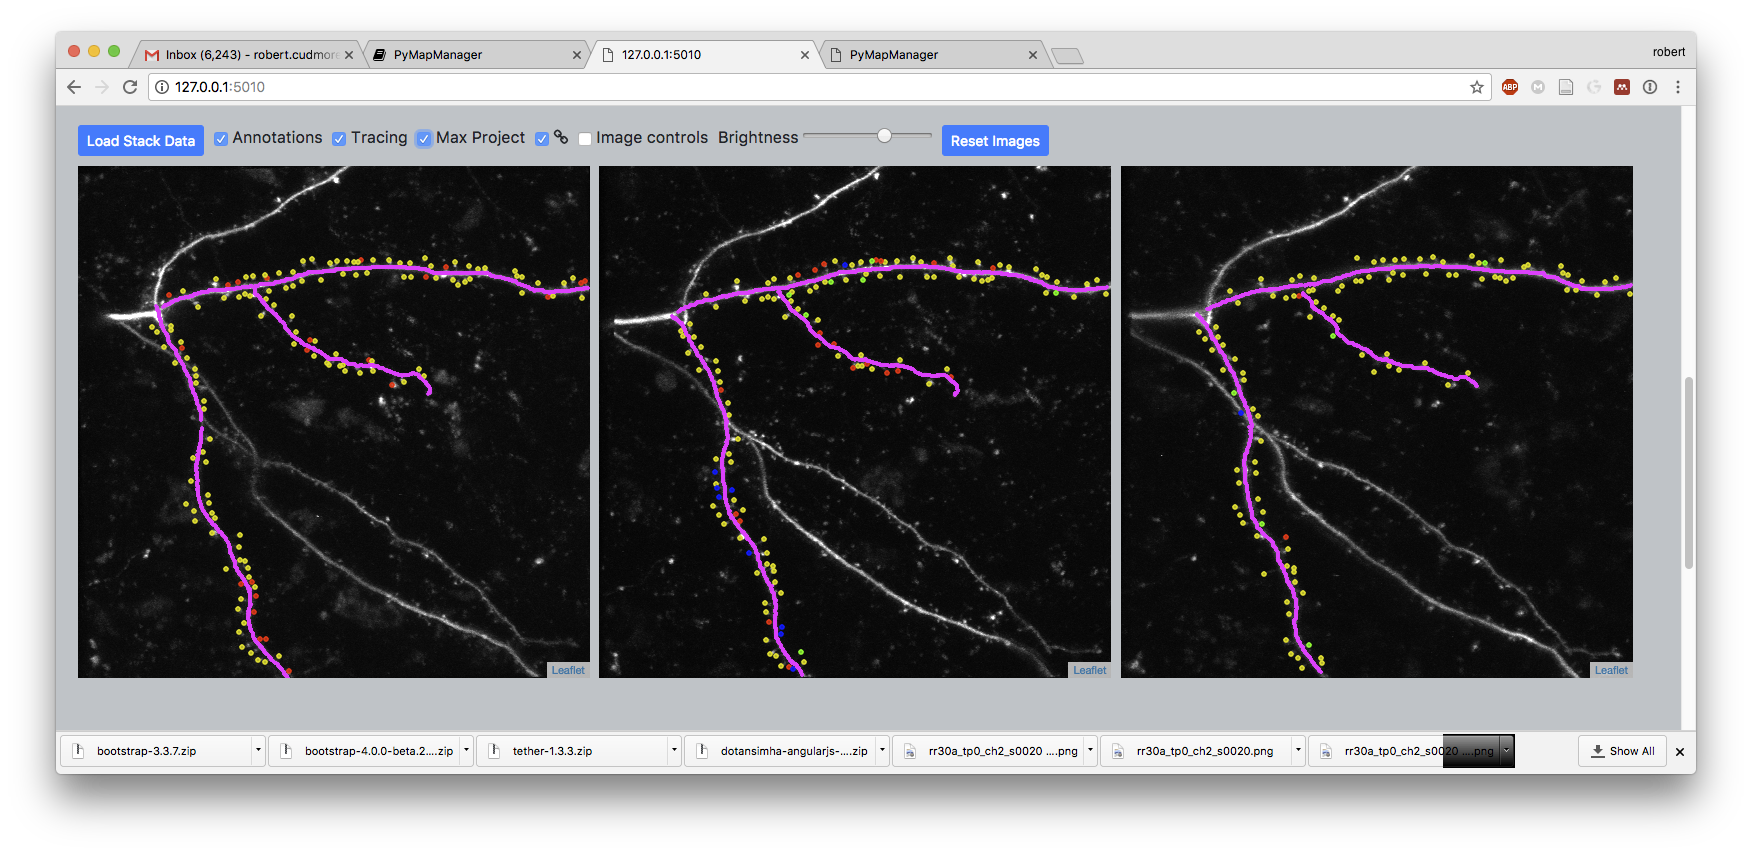
The PyMapManager server provides a web-based front-end to browse Map Manager annotations and images. The PyMapManager server also provides a REST API to retrieve Map Manager annotations and images from within your favorite programming environment.
Browsing annotations

Browsing annotations in time series stacks


3) PyMapManager deskop application
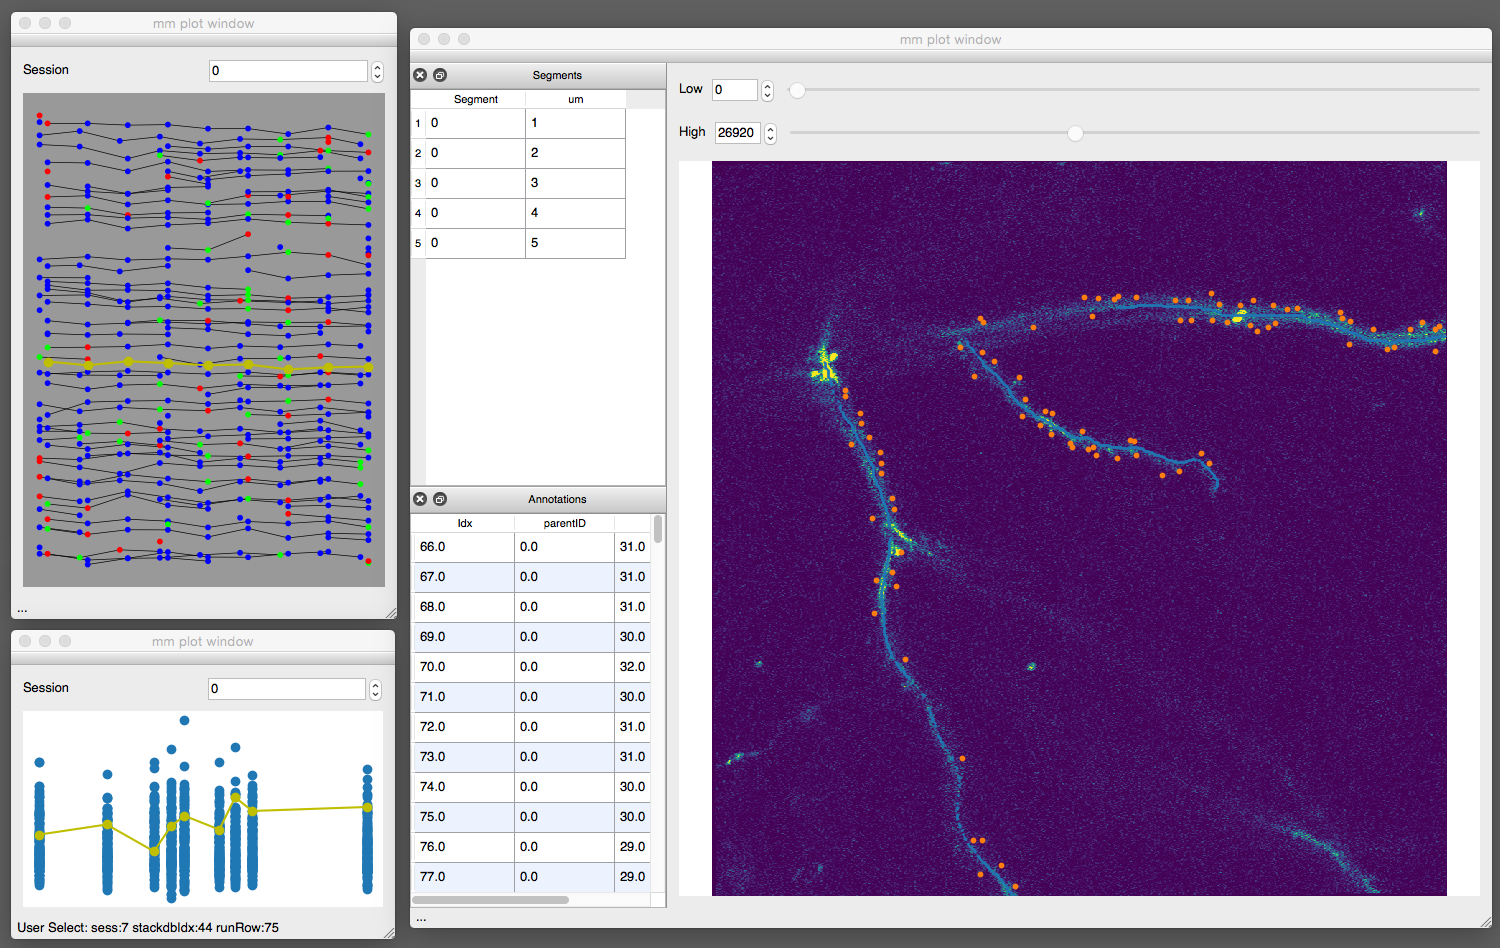
Development of this desktop application has been downgraded to focus on the PyMapManager web interface.
The Qt version of PyMapManager is a desktop application. See /PyQtMapManager.
