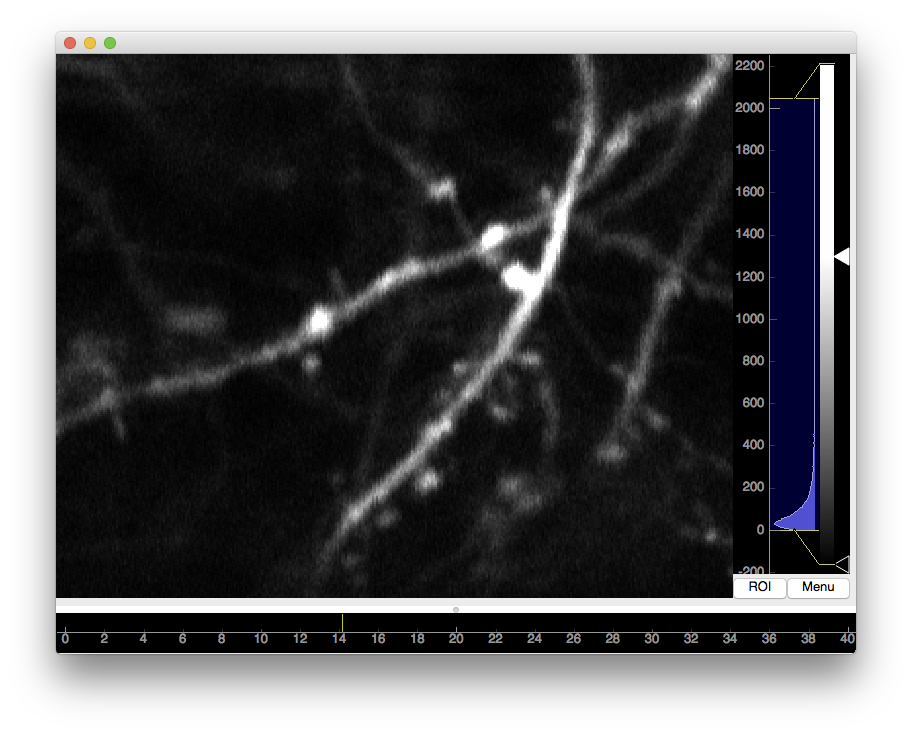
pyqtGraph to display a .tif stack
14 Aug 2015This will display a 3D .tif stack where slices can be viewed and contrast set.
Install libraries
pip install pyqtgraph
pip install tifffile
Python code
import pyqtgraph as pg
import tifffile
tif = tifffile.TiffFile('Desktop/zyF4107_d1_s0_ch1.tif')
images = tif.asarray()
pg.image(images)
To Do
- Not sure how this works for 2 channels.
- See how easy it is to plugin custom python code into PyQtGraph.
- Remove the right contrast slider and bottom slice slider.
- Swap mouse wheel from zooming image to scrolling slices.
- Overlay 3D annotations that are masked. Appear and disappear as a function of slices.
- Select a 3D annotation.
Links
- PyQtGraph
- TiffFile is provided by Christoph Gohlke and is here
